We float uneasily along
Our first stop is the fixed income markets. Take a look at where we were a year ago & the movement of nominal and real rates. Green is today, blue a year ago.
A natural tightening
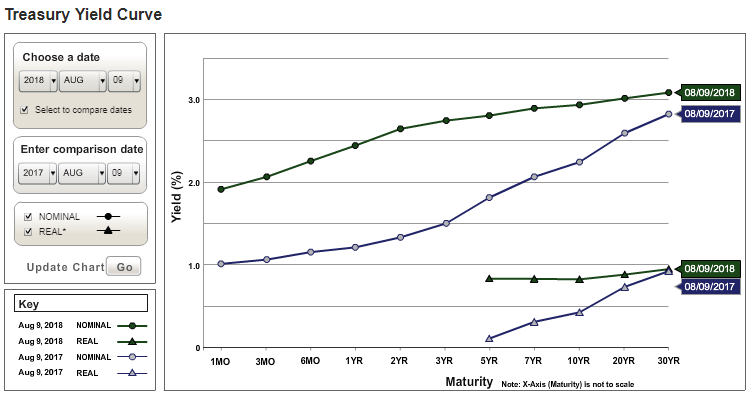
Nominal rates are up across the curve with the biggest movement in the short end, looks like 2 years. Real rates are up significantly in the short end and no movement in the long end. We note again that the 5 year is as short as the Treasury choses to display (which strikes us as an odd and biased limitation on the information displayed). Nominal rates rose also, but we believe real rates drive the real economy.
If we focus a bit on the movement of the yield curve as presented below we see a trend of continued flattening (5 years data below, 10 year less 2’s), maybe some stub of an uptick.
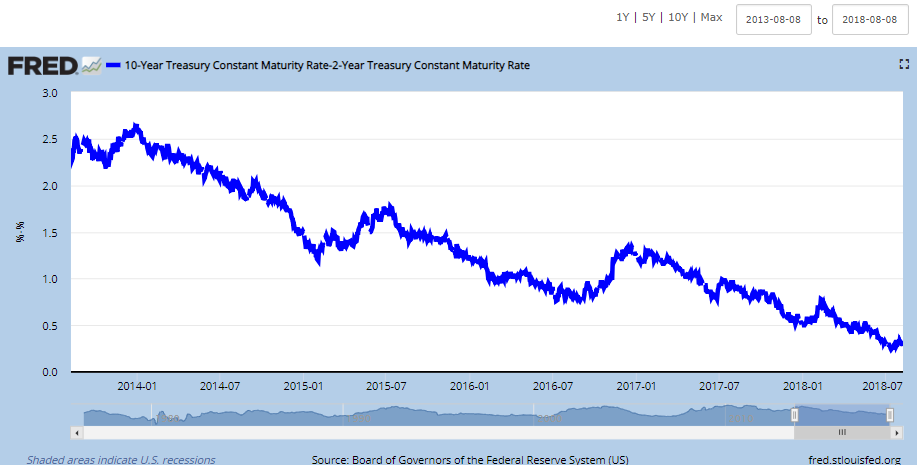
So here we are with 4.1% latest GDP, a continuing trend of flattening, and no movement whatsoever in the real 30 rate year from a year ago. Maybe the lack of movement in the 30 year real rate is telling us that whole barrel of QE monkeys was a useless exercise?
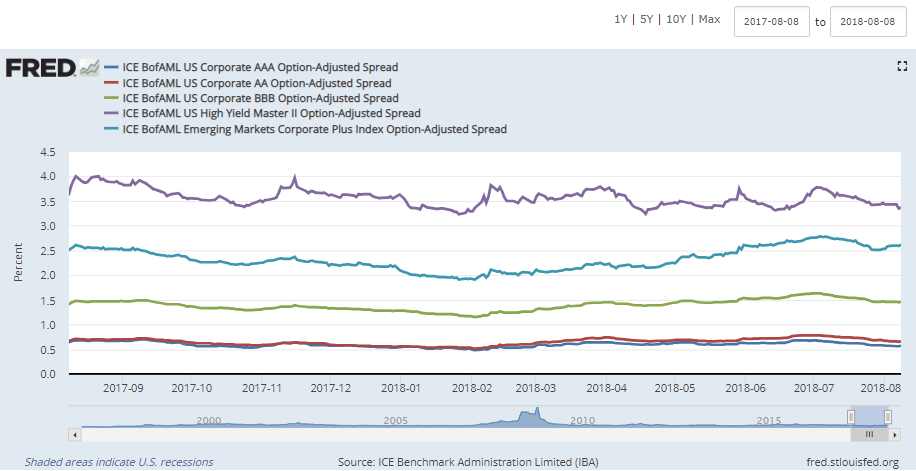
Credit spreads seem stable notwithstanding some outstanding sovereign events like Turkey or Venezuela or coming attractions like Illinois or Connecticut. Small potatoes?
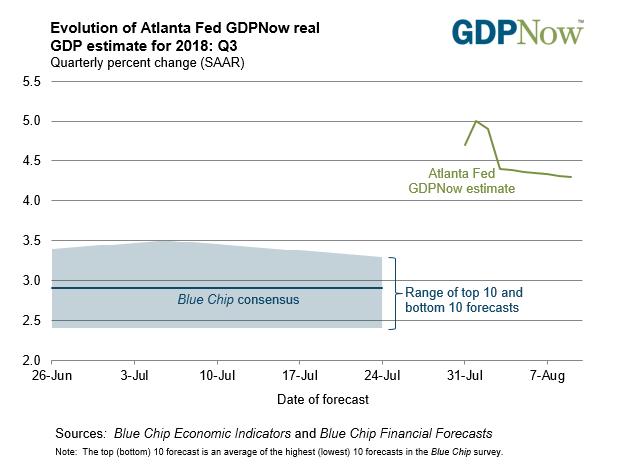
GDP Now expects another increase in Q3, about 4.3%, trade wars, Russians, and all:
Even VIX has gone into a state of deep relaxation, trading at 12.7 as of this writing.
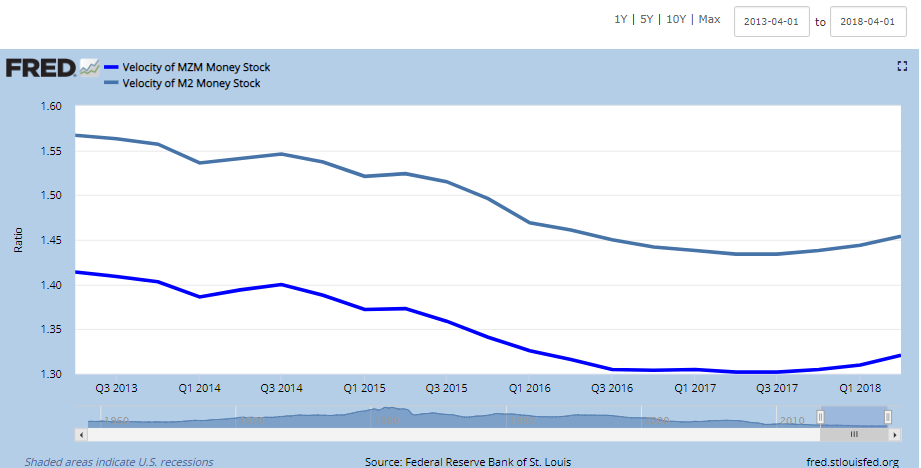
Perhaps money velocity has seen a slight point of inflection upwards after almost a decade of decline. It’s quite possible. All the more reason to watch the inflation indicators.
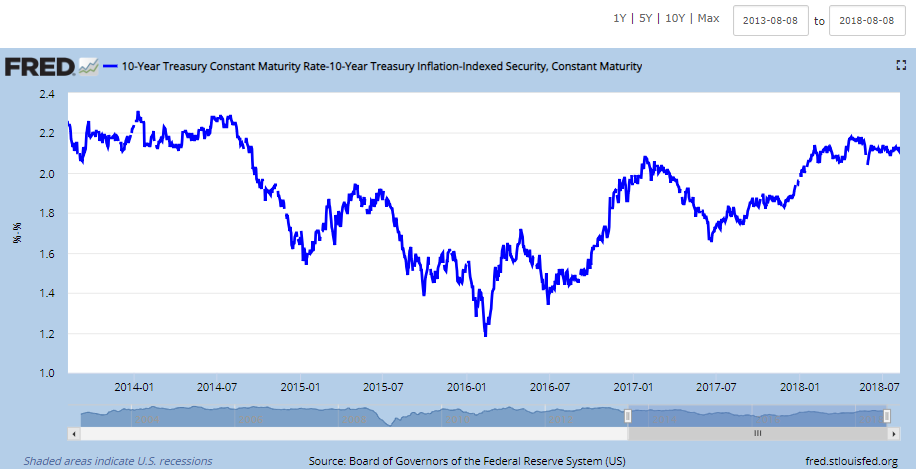
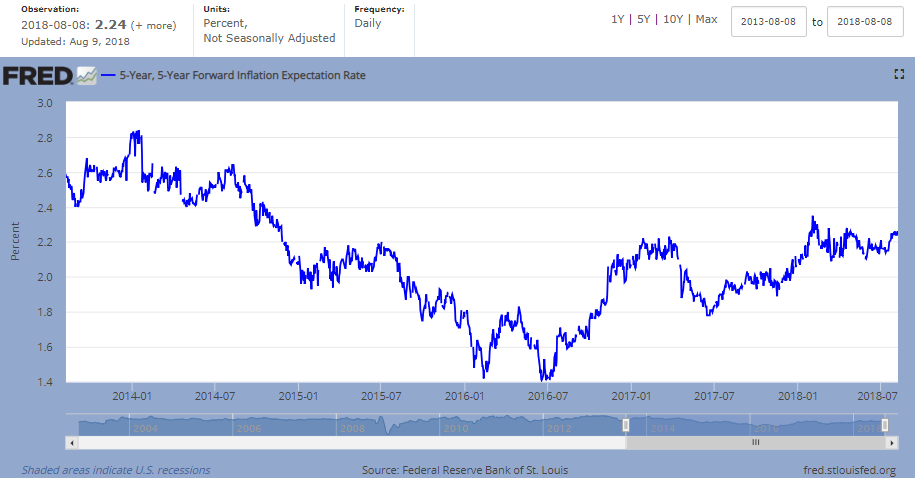
And inflation, which is the fuse that can be very short and by that we mean change very quickly, seems to be holding, at least if we’re looking backwards. Below 10 year nominal less 10 year TIPS, constant maturity, followed by the 5 year, 5 year forward inflation expectation, a measure of expected inflation (on average) over the five-year period that begins five years from today.
Neither seem particularly lathered up.
Valuation ratios of the S&P 500 continue to be high by most metrics. Pick your favorite:
We again return to the long view
Driven by habit and experience we take the long look back, about 10 years. We’ve selected four ETF’s which are broadly based to represent the respective asset classes. Do we really think the long green line is going to keep going up at a 14% annual compound growth rate? Perhaps. Or perhaps not.

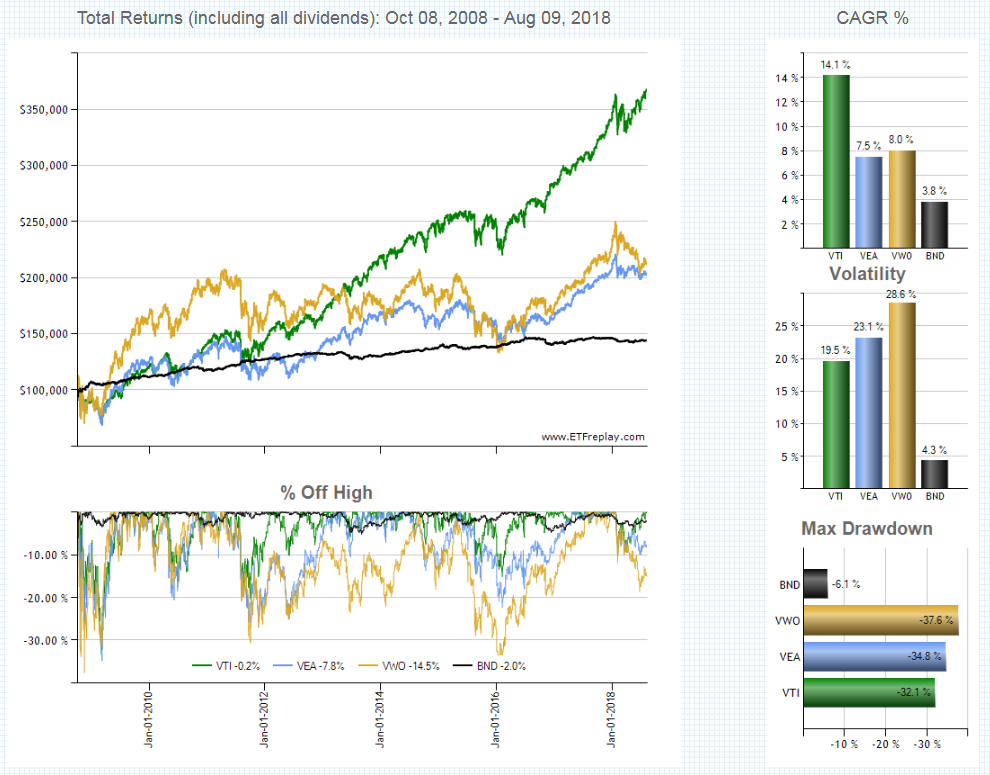
Source: https://www.etfreplay.com/charts.aspx
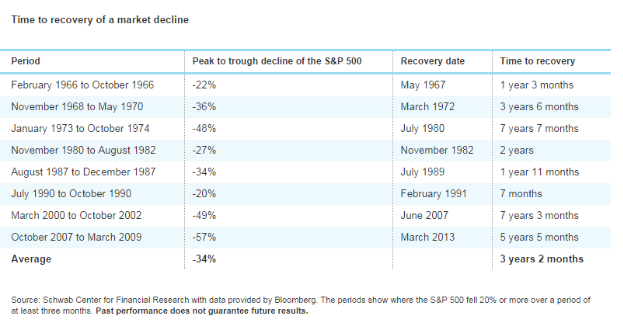
Take a look at the drawdowns which measure the greatest percentage drop from the high (based on Total Return). This we call sober risk assessment.
There are two ways an investor can see a drawdown: the quick way or the long slow grind. We’re not prepared to say whether a downturn will happen or not. Or if one does occur, whether it will be fast & furious kind or the death by a thousand cuts. We are suggesting investors should be prepared.
We stipulate our philosophy is that time in the market determines returns and risk, not timing of the markets, is foundational. In beta returns we trust, not in brokers or ‘smart’ products. We do not pretend that we or anyone else can predict the markets, so we do not try.
We also believe there is such a thing as a business and/or credit cycle. It has not gone away notwithstanding the efforts of the many central planners around the globe. These cycles can perhaps be modified, delayed, accelerated, disrupted or magnified by various policies, scientent or not, but they can not be eliminated. The markets win, central planners lose.
And the whole notion of time in the market is true, provided, however, investors require the liquidity to ride out the full length of the cycle. This is the sober part of asset allocation, the risk budget. We despise the imbecilic, all too brief questionnaires that are so often presented to ~ “help you determine your risk tolerance.” Malpractice comes to mind...
We encourage all to take a look at the data below which we hope will be more helpful. We’ve been looking at it lately.
 hb
hb
Reader Comments