Q1 2017 Review & Outlook: first, the rear view mirror
Equities
It is difficult to convey the magnitude of the quarterly performance of the equity sectors, perhaps less so for the fixed income markets. Below are the total returns of exchange traded funds that we use to represent the total US stock market [VTI], all non-US equities [VEU], emerging markets [VWO], the aggregate US bond market [BND] and the short term investment grade sector of the US bond market [VCSH].
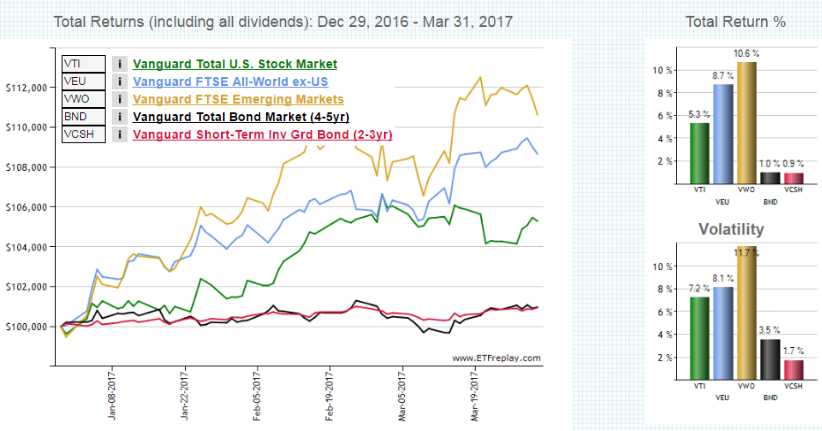
Not to be dramatic, but if we annualize the nominal quarterly returns to an annual compound basis we see some supra-normal returns:
Total US equity market: 22.9%
Non- US equity markets: 39.4%
Emerging markets: 49.7%
US aggregate bond market: 3.5%
Short term US investment grade bonds: 1.7%
Do these returns look like anything in the real economy? We think not, and not just on the basis of the rearview mirror. We’ll get into that a bit later. Runs like this are dramatic, but we caution investors in current circumstances. While we’ve enjoyed the ride of QE and the pricing of the expectations of political reform, we are concerned about a disconnect between current market valuations and a sober view of economic expectations for growth and earnings in the near to intermediate future. Here’s why.
Let’s cheat by selecting a biased timeframe of analysis. From Feb 27, 2009, to March 31, 2017, SPY, an S&P 500 ETF, had a total return of 278% or 17.9% on an annual compound basis. So if you were in the market, stayed there and reinvested the dividends, you almost tripled your money and earned about 18% on it every year. Welcome to QE and a low entry point.
Do you recall hearing about how great the economy was in 2009? Or since? We do not. The Obama recovery is the weakest in the post World War II era. Note the 2.1% average annual growth in GDP since the U.S. recovery began in mid-2009.
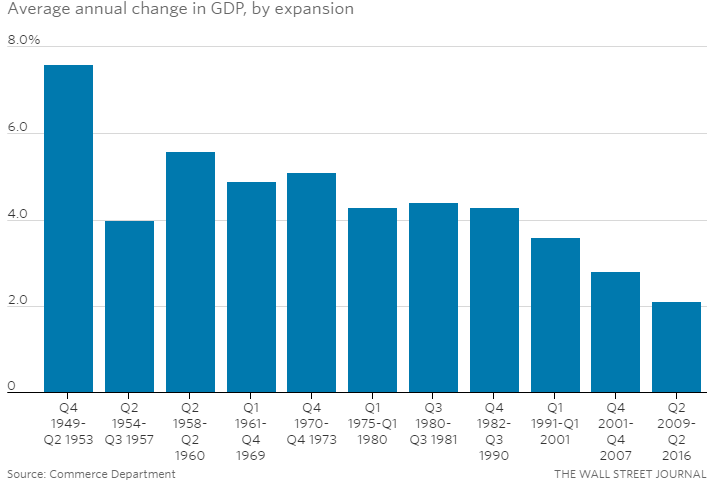
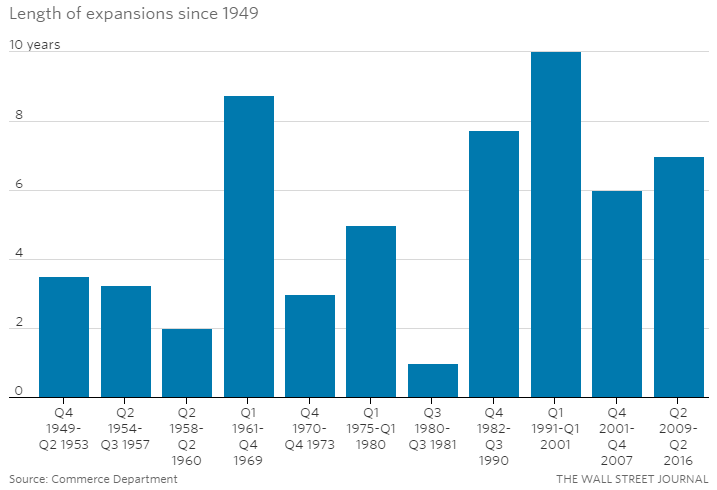
The recovery has been the weakest, and yet remarkably is one of the longer recoveries. How long will it persist?
More importantly, did the economy in crisis and ‘recovery’ eliminate the structural constraints and market imbalances such that a robust recover could eventuate? Or do they still remain in some form? Are we on the verge of an American Renaissance or do we continue to suffer from too much regulatory excess, malinvestment, regulatory capture, excessive leverage, and corruption? Have we placed insurmountable and unmovable burdens on the productive machinery that will take years to repair?
We tend to share the view of Jeffery P Snider of Alhambra Investment Partners:
economic indications beyond payrolls continue to suggest only sustained weakness. There is improvement in most accounts beyond the labor market, to be sure, but like the labor market data nothing that is close to convincing that a positive inflection is even realistic let alone close at hand. Source: http://www.alhambrapartners.com/2017/04/07/who-carries-the-burden-of-proof/
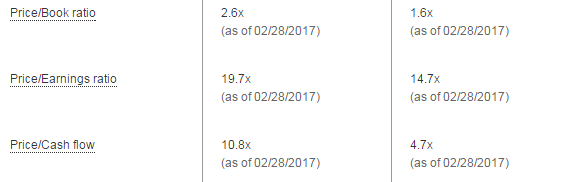
Valuation
The equity markets seem fully priced for robust and increasing future growth, and seemingly have been for some years. Pick your metric: equities are not cheap. Whether the growth materializes to sustain current levels remains to be seen. We think it’s a long shot.
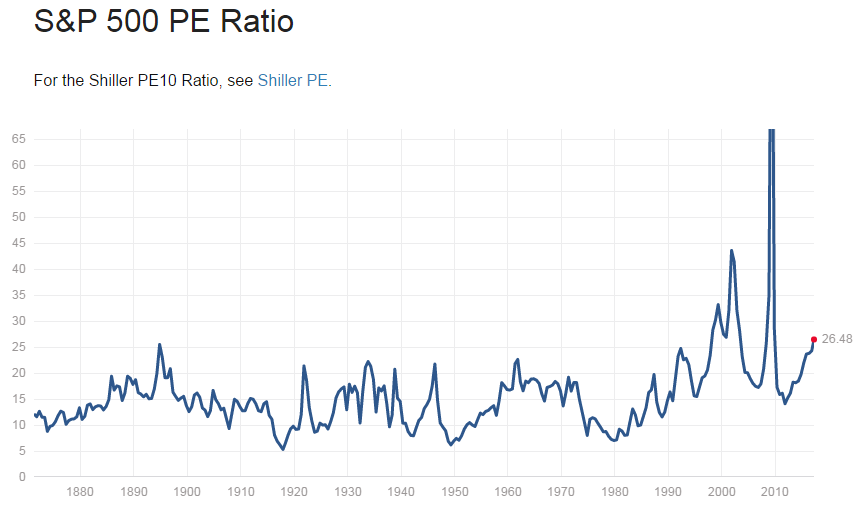
Rem: above on 12 month trailing PE, as reported basis
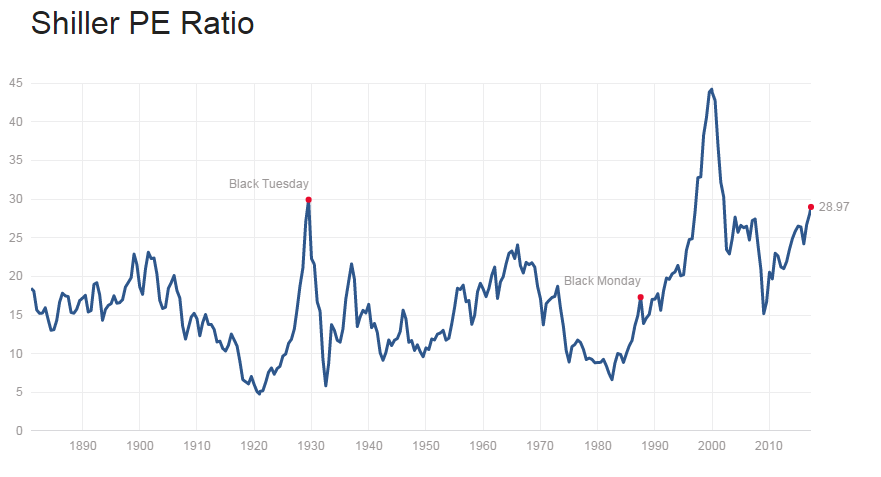
Rem: above rolling 10 year average, inflation adjusted PE
Source: http://www.multpl.com/
There are many other metrics of valuation, and we present only two, but our point is simple: we think the market is vulnerable to multiple compression. And that could be induced by any number of factors... declining productivity, delays in regulatory & tax reform, geopolitical shocks, or political crisis.
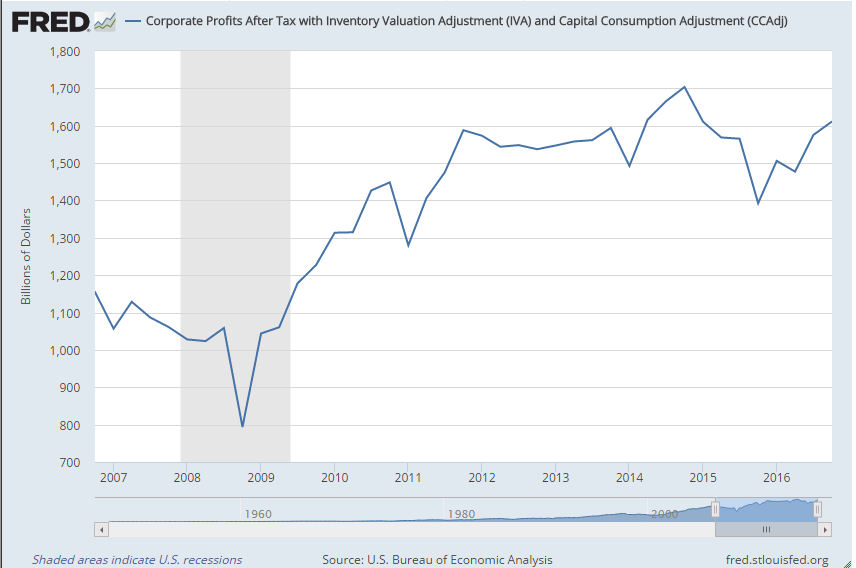
Corporate profits seem strong (data thru Oct 2016 below) and the resurgence in Q4 is evident.
That seems to be continuing as the S&P 500 anticipates near double-digit earnings growth for Q1:
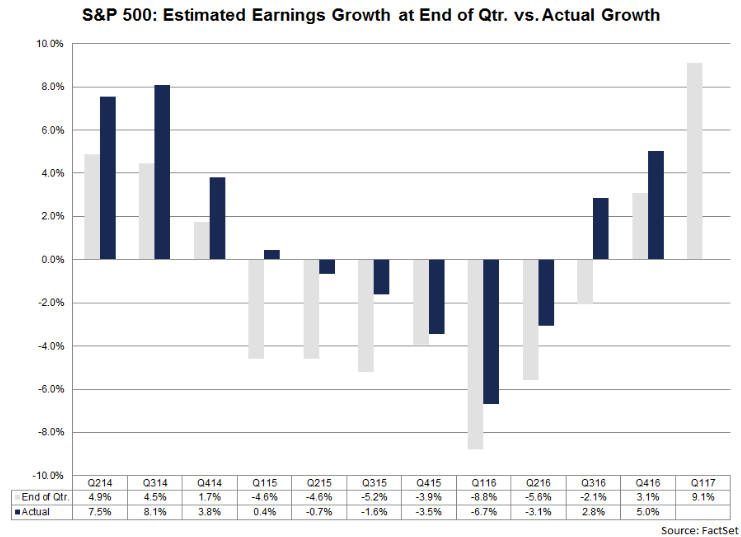
Source: https://insight.factset.com/earningsinsight_04.07.17
Some credible analysts suggest the expansion of the business cycle has another two years to run absent a premature death by rate hikes from the Fed. That longevity may very well be a reasonable interpretation.
But what does the Atlanta Fed think about future growth?
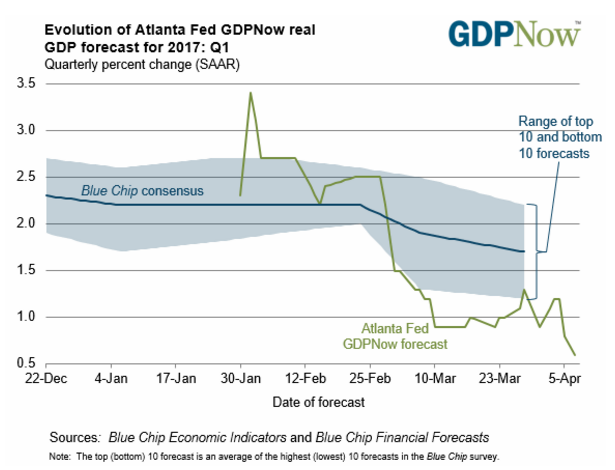
Maybe the folks in Atlanta have been looking at this: declining Commercial & Industrial Loan Growth.
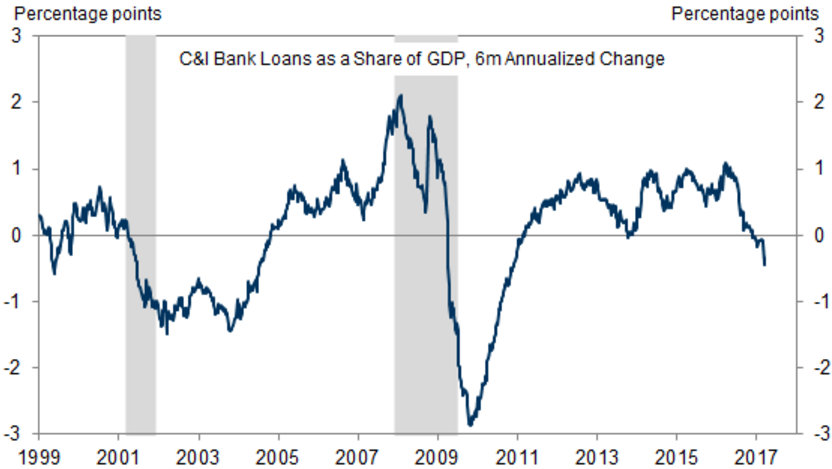
Source: http://www.zerohedge.com/news/2017-03-29/why-loan-growth-collapsing-goldman-has-one-theor
Fixed Income
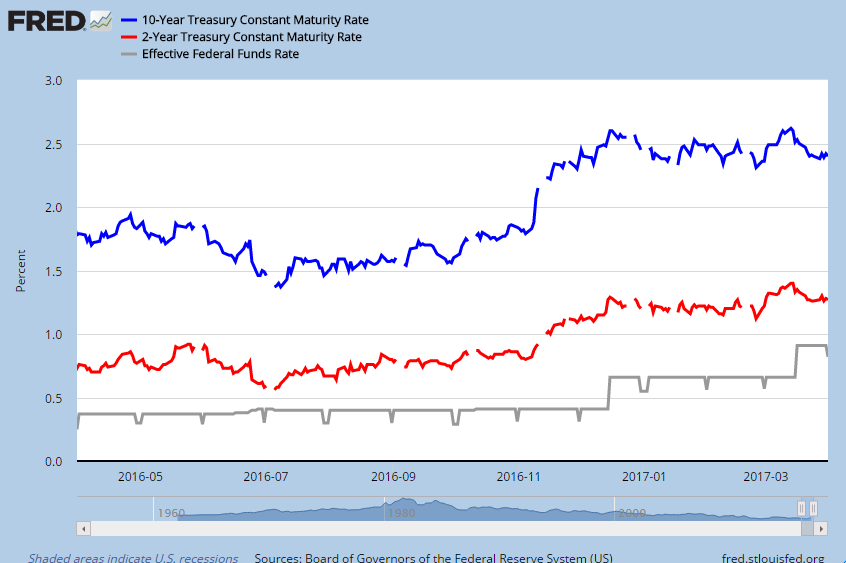
And what do the fixed income markets convey? On March 15, 2017, the Fed raised short term rates by .25% and stated their intentions of further increases. Immediately, yields on both the 2’s and 10’s declined, signaling a less robust view of the economy, one contradictory to the Fed and the equity markets.
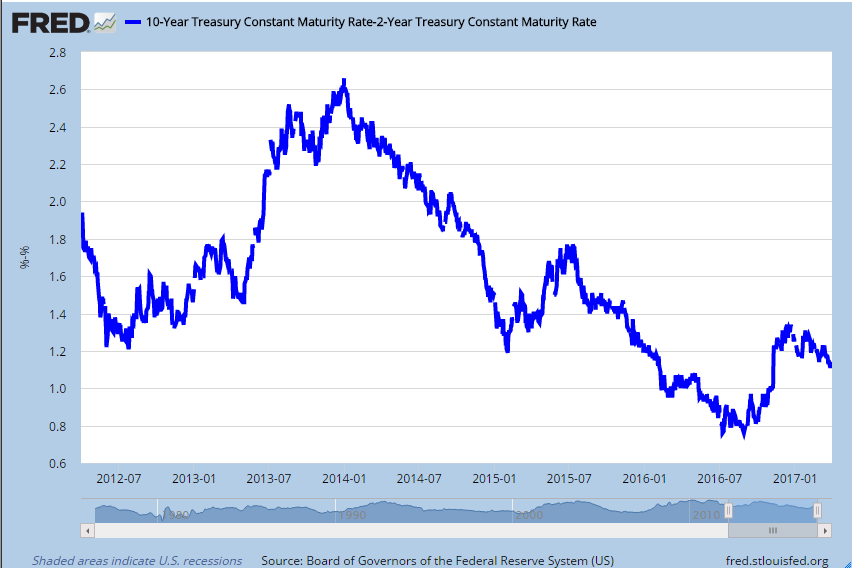
Of greater valence is the spread between 10’s and 2’s below: since December of last year the spread has been declining. A flattening yield curve is typically indicative of a weaker economy (rem: data below thru 3/31).
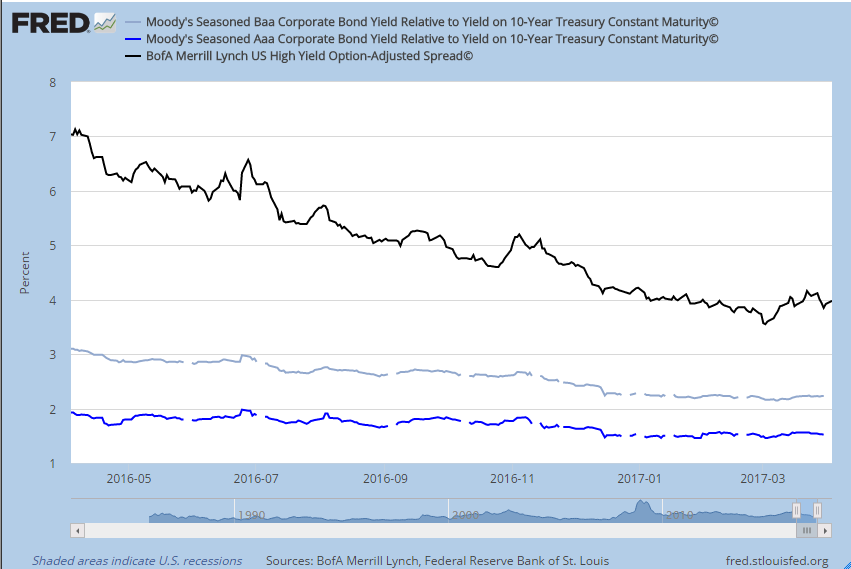
Credit spreads seem to be declining or stable which indicates, more or less, equilibria. Seemingly no tightening in the credit markets, other than a recent pop in high yields. No news is good news.
Inflation
Inflation expectations impact fixed income and equity markets. It changes the valuations and impacts future expected returns of pretty much everything.
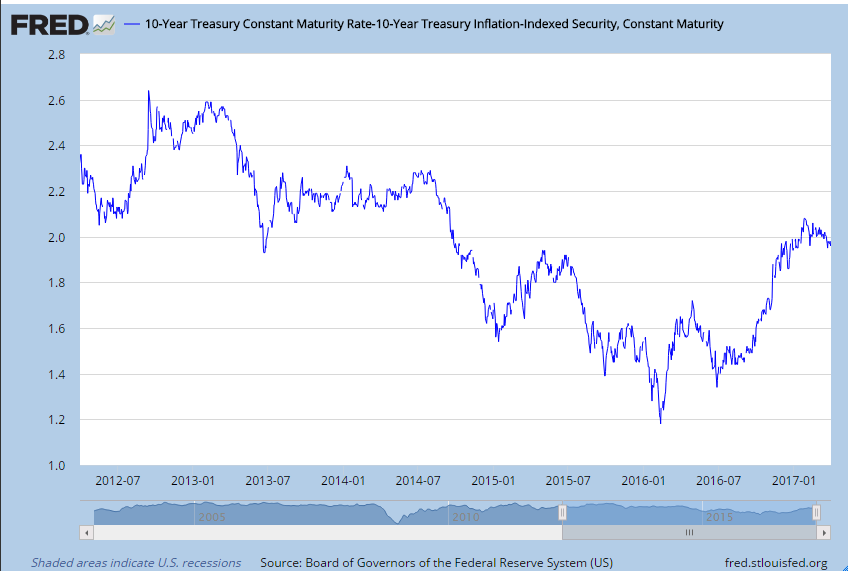
The spread between the 10 year TIPS and Treasury is right on the Fed’s target at 2%.
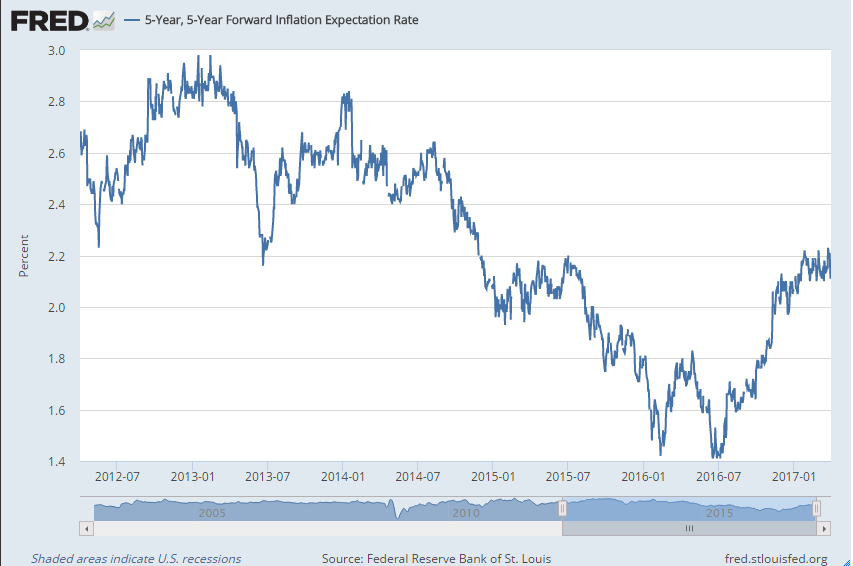
The 5 year, 5 year forward inflation expectation rate is slightly above the 2% target ( the 5/5 forward rate is a measure of the expected inflation over the 5 year period that begins five years from today) . Both current and forward indicators of inflation are stable and generally now in synch with Fed objectives. This in connection with stability of credit spreads, and the employment numbers is probably why they raised the funds rate.
Outlook
The most important issue we see on the horizon is the likelihood of sustained lower future returns relative to recent history. This is systemic in nature and effects all investors and touches on issues such as retirement planning to pension solvency. Lower than expected returns can also impact risk tolerance, and consequently appropriate asset allocation. No one can duck this one (except politically controlled pensions which will go bankrupt because of it).
Rob Arnott, of Research Affiliates, lays out his thinking on prospective returns over the next decade in an email cited in The Unavoidable Pension Crisis:
“Quoting from his letter (in which he assumes the typical 60% equities/40% bonds ratio that most pension funds use), here’s the math:
40% Bonds. Yield is 2% for the US aggregate bond market.
60% Stocks. Our base case is 5.4% for US stocks, but we think valuations are too high, so we trim this to 3.3% for the coming decade.
...Add up the return from stocks and the return from bonds, and we get 2.8% to 4% from our balanced [60% equity/ 40% fixed income] portfolio.”
That’s not inconsistent with the range of ten year real expected returns of a 60/40 portfolio laid out by Vanguard in their 2017 economic and market outlook: Stabilization, not stagnation in which they characterize their outlook as the most guarded it has been in 10 years. Their analysis produced a median return 3.8% (ranging from 5th percentile -2.7% to 95th percentile of 10.4%). For context the median real return on the same allocation from 1926 to 2016 was 5.5%.
There is a competent body of evidence that suggest that higher entry prices into the market are a predictor of future lower returns, and this seems to be echoed by those such as Vanguard and Arnott. And what is the mantra, “Buy low, sell high...?”
Neither institutions nor retail investors should be planning of 7-8% long term returns for balanced portfolios.
Risk & volatility
The second most important issue we see is valuation risk to equities. We do not see modest incremental increases in the fed funds rate as necessarily harmful to equity returns in context of a firming economy. We do, however, see the risk of multiple (PE) contraction if growth is weak or negative. We are less concerned about interest rate risk simply because it is known and more easily managed.
We continue to expect spats of volatility which could be sizable. Trump’s reforms of large economic consequence (tax reform, immigration, and trade policy) may prove beneficial in an intermediate 3-7 year timeframe but one suspects getting through years 1-3 could get rough simply by virtue of the scale and complexities of the issues up for reform.
We also see a schism of expectations between the equity and fixed income markets. Both of them can’t be right and a reconciliation of their two outlooks seems increasingly likely. Something will likely get bumped... with direction and magnitude unknown. This goes to risk tolerance and asset allocation.
Derisking tilts
We were recently asked about adjustments one might make to de-risk a portfolio which stuck us as a timely question. Our view is that the only reason we invest in bonds is to mitigate equity risk. If we had no risk constraint (ie let Risk = 100%), we would not invest in bonds.
In a de-risking scenario one might reduce the equity allocation, say, from 40% to 35% or 30%. One might consider as part of that process increasing the proportion of foreign equities relative to US within the overall equity allocation (given more favorable relative value, meaning foreign equities are cheaper than US). So as a defensive/de-risking alternative they seem attractive relative to US stocks which seem fully valued. The discounts are non-trivial.
Relative Value for US and non-US equities (for VTI/VEU respectively, source Vanguard)
De-risking fixed income might typically shorten duration and lighten up on weaker credits. We continue to favor investment grade credits, but stipulate spread risk in that sector. Ultimately the best course of action depends on future outcomes which are unknown. We do know the sources of risk & return in fixed income, and here's a simple menu of strategies:
•shorten duration (for example via BSV or VCSH)
•assume the market profile (i.e. the market portfolio qua market BND and BNDX or others)
•go long (BLV)
We’re not advocating any particular course of action here, which actions depend on the investor’s view, but simply point out that a de-risking tilt might incorporate some combination of the first two items. We would encourage modesty and humility in one’s confidence in making such tilts and note that none of the above are riskless, and all entail opportunity cost of one variety or another.
Given the uncertainty we believe it is imperative to remain diversified, and we encourage moderation in any portfolio tilts.
...
Many of the issues here are why we like the mechanics of rebalancing within the framework of an appropriate asset allocation as a risk disciplined, moderate manner of guiding clients through cycles. It seems to work. Over the long term it tends to produce the level of risk & return of the allocation one selects.
...
Lastly, we share a grimly morbid read on the state of the auto industry but it is good news for those looking to buy a used car in the near to intermediate future: The Next Subprime Crisis Is Here: 12 Signs That The US Auto Industry's Day Of Reckoning Has Arrived.
 hb
hb
Reader Comments