2015 Q4 Review and Outlook: What Every Flying Machine Man Thinks
“Monetary policy made itself ineffective with low interest rates, which were seen as a cure rather than a transitory painkiller.” - Nassim Taleb
Our economic view remains from last quarter’s. We anticipate a recession in the US with about a ~60-70% probability starting sometime in the next 6 to 24 months, assuming that we are not unknowingly in the front end of one now. Given the timing of the national elections, we do not anticipate any material reform of our wayward domestic policies. Political paralysis with essentially a sideways and weak GDP, say ~2%, seems our best case.
To the downside we see an increasing likelihood of a disruptive environment for our domestic and foreign political economies. It is possible, if not likely, that the President will continue to act by unitary fiat rather than in accord with legislative process, and if so, the political volatility & costs of a serious Constitutional conflict between Congress and the President could well inflict itself on our markets and economy... not to mention the Middle East.
Regulatory and compliance burdens, now likely well in excess of 12% of GDP, will increase and add to the dead weight of the economy with non-trivial opportunity costs. The problem of excess leverage at all levels of global governments will remain unaddressed. Consider that “global debt has grown by $57 trillion since 2007, according to a report from the McKinsey Global Institute. More dead weight.
We still have some really Big Things that aren’t working:
-
the Fed has yet to realize that the Phillips Curve does not work, does not accommodate zero or falling inflation and rising/full employment. Way behind every trade & trend and data dependent only on self confirmation. As Donald Luskin wondered, “Dear God, what are they thinking?”
-
utter disruption/destruction of the energy & commodity complex.
-
negative rates are now the norm of much of Europe and other countries, so we watch the Currency Wars as predicted by James Rickards.
A telling conversation with an HFG (hedge fund guy): “I don’t know if this business model works anymore.” WWB: “I don’t think it’s specific to your or any business model. Everything is screwed up. The pricing mechanics of the markets have been impaired. No markets work without real prices, and almost all the markets are now manipulated. What you can price looks overvalued, and what you think might be cheap, you can’t value. Look at equities, hugely expensive. Same with fixed income. Look at the inverted swap spreads or the FX markets where arbitrage doesn’t work. Look at the migration of human and financial capital withdrawn from the liquidity function (ie trading desks and inventory) at all the major market makers globally. Look at repo fails. We have some big things that aren’t working here. Controlling (or more accurately manipulating) the price of money is foundational and impairs the all the dependent pricing mechanics of all sectors. This leads to malinvestment. At some point the fog gets too thick, and everything slows down. That’s where we are. It’s tough to price a quarter at 25 cents.”
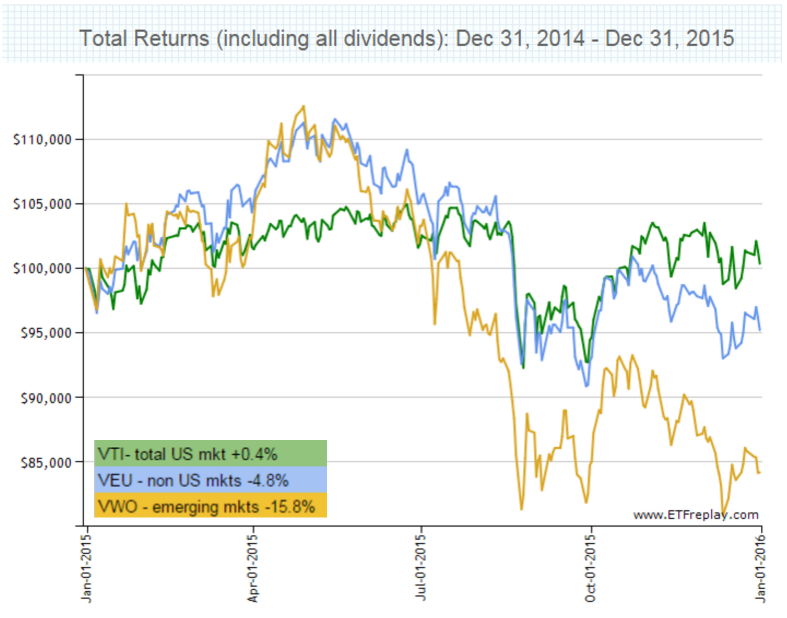
Equity markets: In 2015 the broad US markets (VTI) essentially went sideways up +0.4% on a total return basis, non US markets (VEU) lost approximately -4.8%, and emerging markets were substantially down, nearly -16%. Only large cap growth stocks, essentially the tech stocks, were +3.2%, nothing particularly to write home about. If you exclude the nifty 9 tech stocks the market was significantly negative for the year.
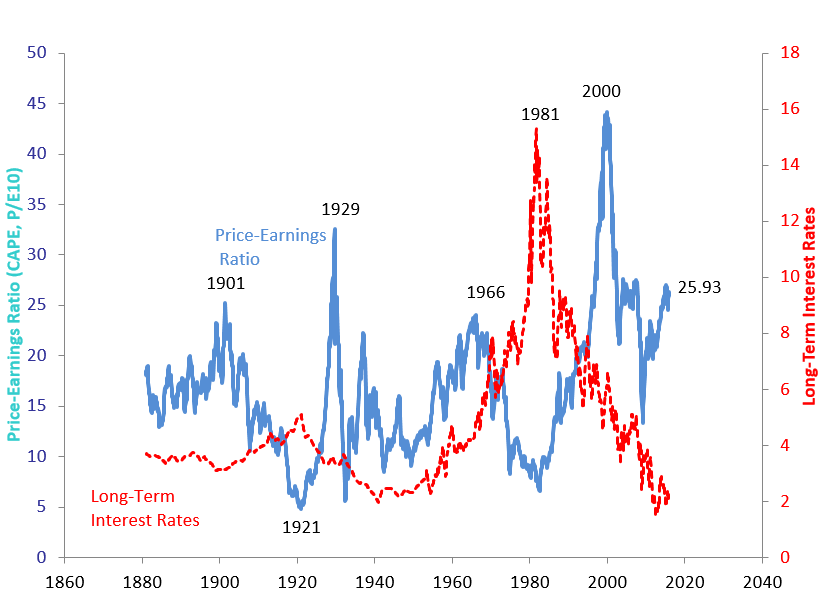
Valuation: We think domestic equities are fully if not excessively valued. The chart below presents in blue the Shiller CAPE (Cyclically Adjusted Price Earnings Ratios, the chart & data for which may be found here). It is a price earnings ratio based on average inflation-adjusted earnings from the previous 10 years. We’re currently around 26x, and you can see it’s in pretty rarified territory. The red line is the 10 year Treasury yield, and suffice to say it is low. Very low, but we’ll get to that later. For sake of clarity, we’re not putting forth CAPE as a dispositive measure of value. It is one indicator among many, some of which you may find here, but CAPE is non-trivial. The regular PE for the S&P 500 is now around 22, which is in historical context also rather high.
Within the array of domestic equity styles nothing much mattered but large cap growth stocks which marked ~3.8% total return. Think GOOG, APPL, AMZN, NFLX, etc. The PE’s of NFLX and AMZN are a sobering example of excessive valuations: 305x and 980x respectively.
For the technically inclined in the audience, since 2009 growth stocks have outperformed value stocks and this puts a bit of a crimp into the Fama three factor model (which holds that small cap & value stocks tend to outperform). We stipulate a 7 year lookback is probably too short to be dispositive, but it remains noteworthy.
All of this highlights the importance of diversification: “Today the CAPE stands at over 26 for the U.S. market, well above its long-run average. The CAPE is 20 for Japan, 15 for Europe and under 10 for emerging markets—below their long-run averages. I am not suggesting that you try to time the markets and shift from one to another based on these metrics. But I do suggest that if your equity portfolio is composed entirely of U.S. stocks, you might add some foreign stocks in 2016.” - Burton G Malkiel in Investing for 2016 in an Expensive Market
Commodities were decimated this year and largely driven by the disruption of the energy complex. The Saudis need cash and a lot of it for two non-negotiable purposes: military expenditures and collective baksheesh for social stability. Many suspect the Saudis also believe they can, by virtue of their estimated ~($28-22?)/bbl lifting cost, disable North American energy along with Russia and Iran.
Maybe. Or it may be that the frackers are looking for them all with ingenuity, technology & innovation. Frackers are a tough and resourceful bunch who have so far transformed the global energy business by putting a permanent & downwardly flexible cap on energy prices. I recall a conversation with the boss of a fracking crew at a Microtel in western Pennsylvania last winter. I asked him,
“Assuming I had the land and was ready to sign right now, when could you have me pumping?”
“Oh, probably in 5-6 weeks.”
“5-6 weeks? You’re kidding?”
“Well, no. I mean if everything goes ok... if we don’t encounter any extraordinary problems... yeah, 5-6 weeks is about it.”
Moreover, the innovation and advances in drilling & fracking technologies are ongoing. It will get cheaper and continue to lower the cost of extracting new & old reserves. As to the currently low prices? They will cap the wells and wait; start exporting natural gas in size; and innovate and work on getting the costs down. But don't underestimate the stress on the commodity complex.
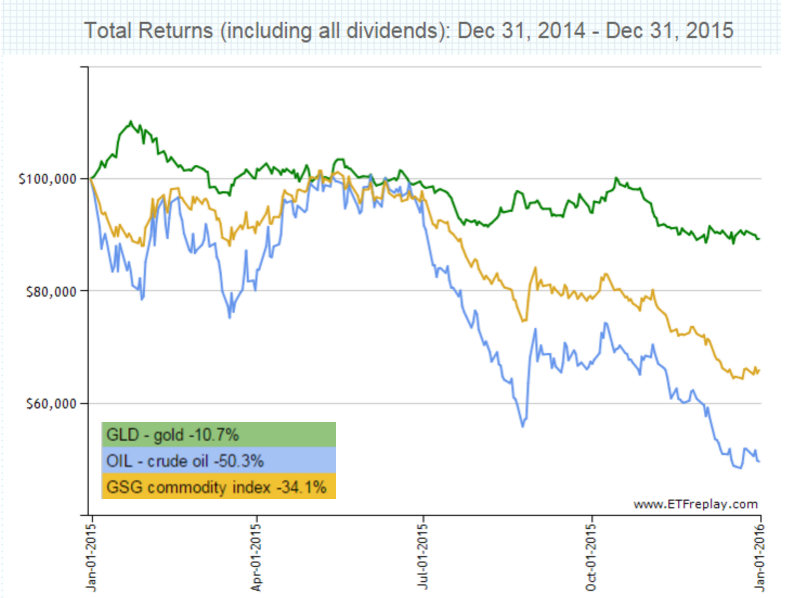
While not without considerable short term costs to undercapitalized companies and their suppliers globally, we view the depression in energy prices as a potential long term positive for the US economy and a huge negative for Russia, the Middle East and other cash strapped emerging energy producers. It may give the US some breathing room. We are inclined to see gold’s performance as a deflationary signal.
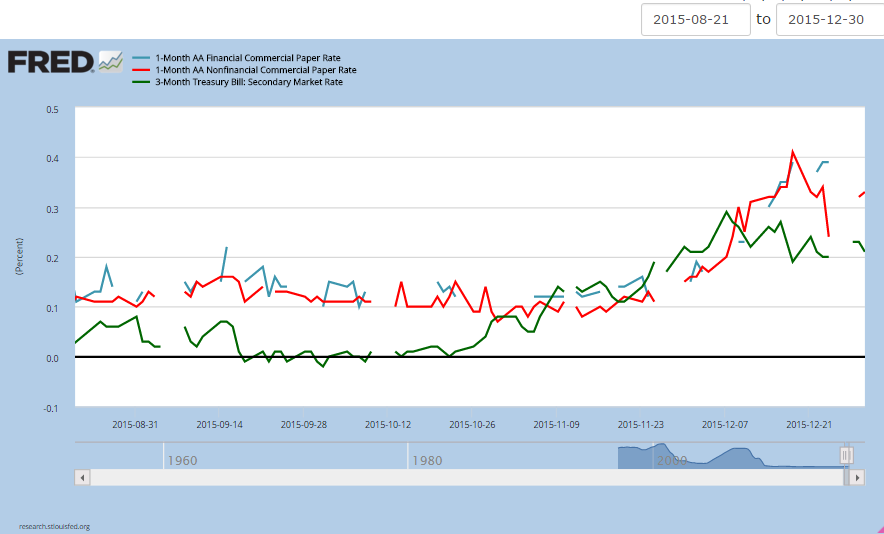
Fixed income markets: Let’s start at the very short end of the yield curve where we can see the impact of the Fed’s move in the 90 day T-bill and commercial paper rates. This may be almost enough to stop the chronic losses of US short term money market desks. It will not likely be enough to generate any material positive returns to short term investors in the near term. The ultimate impact on long term rates remains to be seen.
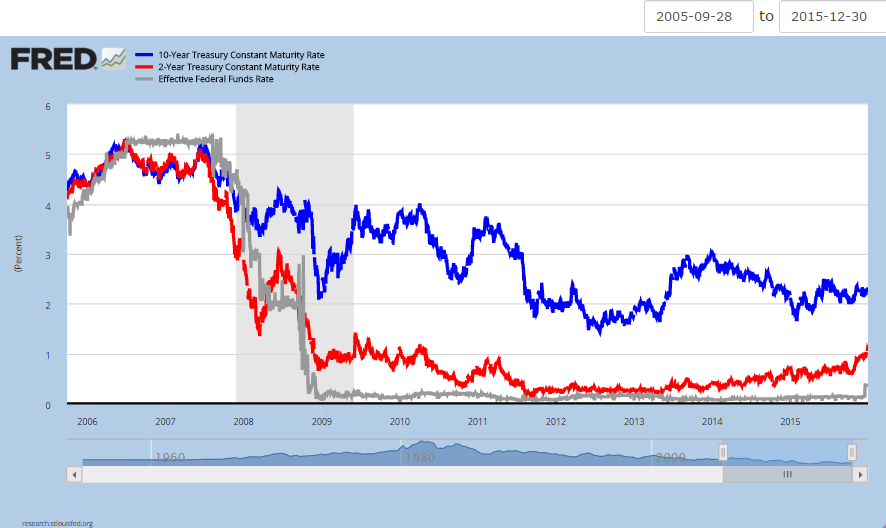
Moving out the maturity curve below are the Fed Funds, 10 & 2 year Treasury rates. Nothing particularly dramatic here other than a pop in the Fed Funds rate and commensurate slight rise in 2’s. It’s kind of hard to tell anything happened given the benign response of the 10’s, but note the continuation of a flattening yield curve (10’s less 2’s) which typically is indicative of a softening economy.
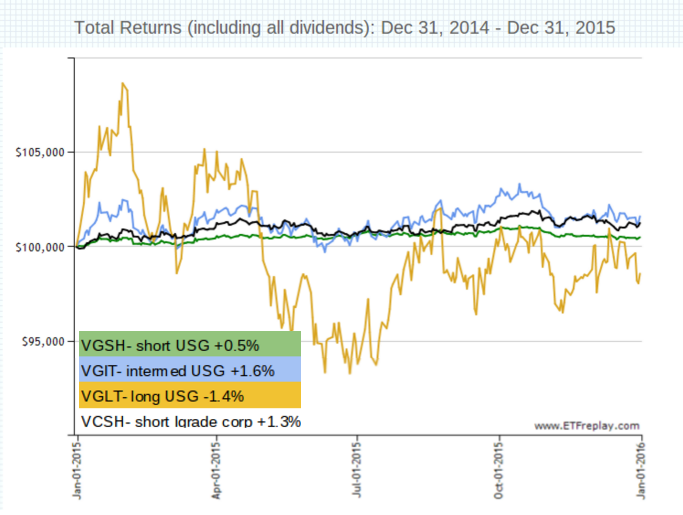
Below are ytd total returns of three broad sectors of US Government debt (Short Term, Intermediate and Long Term) and an indexed ETF of short term investment grade corporate debt. One might have thought for all the jawboning leading into the rate hike it would have had greater and immediate impact on the annual total returns of the short and intermediate term funds. Fixed income investors should note the decline of long term product. Is it a harbinger of things to come?
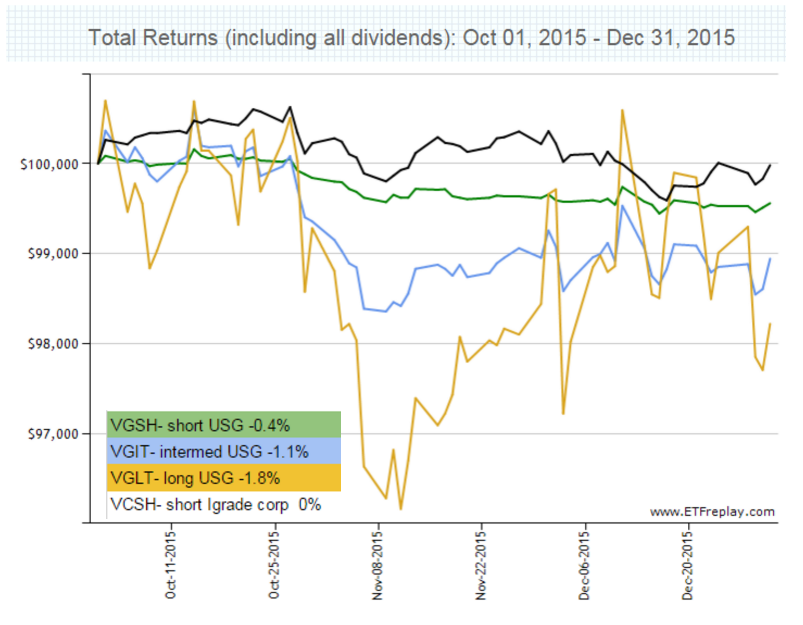
If we shorten our perspective to the past 3 months, we get a better view, and all three US Government sectors ended negative for the period. Note that short term investment grade corporate bonds were flat on a total return basis due to credit spreads, and look how Long Term government bonds strengthened (i.e. rates declined) for about a month and a half right into the hike. Not a vote of confidence in the Fed.
Something investors need to consider: are we sure rates are going to go up in any sustainable way? Maybe not. The Fed has held the zero interest rate policy way too long, well past the point of diminishing returns (if there were any ‘returns’ to ZIRP to be had) and may well be tightening into a weakening economy. Might we see the yield curve just flatten as the Fed jams short rates higher while the long term rates just stay put or fall in anticipation of a weak global economy? It actually matters a lot to both equity and fixed income markets.
In any event bonds are not risk free, and that notion is beginning to sink in with those who designed certain target dated investment products. Consider product design on Wall Street: Funds That Sought to Cut Risk With Bonds Are Having to Think Again.
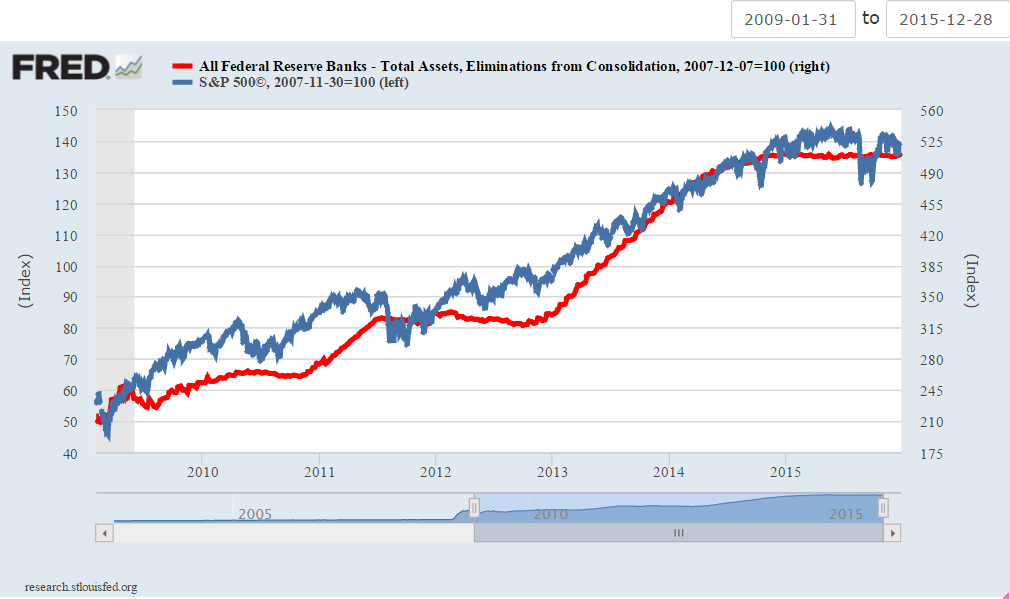
No one, including WWB or the Fed, has a clue as to the future path of interest rates. But we do know what the QE picture looks like since January 2009. It is less clear how it works in reverse. No one has seen this before. Our best guess is that the unwind of QE and the Fed’s balance sheet will, economic conditions permitting (whatever the Fed deems that to mean), take place very slowly & incrementally, if at all, over the next decade. They’re in a bit of a box which means investors are also.
At base we and the Fed need to recognize that the Western model of modern commerce as we know it does not function with negative nominal rates which are now the rule for Europe. ZIRP was costly enough, thanks.
“In 2014 alone, US households lost an additional US$ 170 billion in foregone interest rate income as a result of unconventional central bank policies – called financial repression. Building on the figures released in our study, Financial repression: The unintended consequences, this amounts to a total loss of USD 670 billion since the 2008 financial crisis.” - Swiss Re The money tap continues to run, while savers continue to suffer
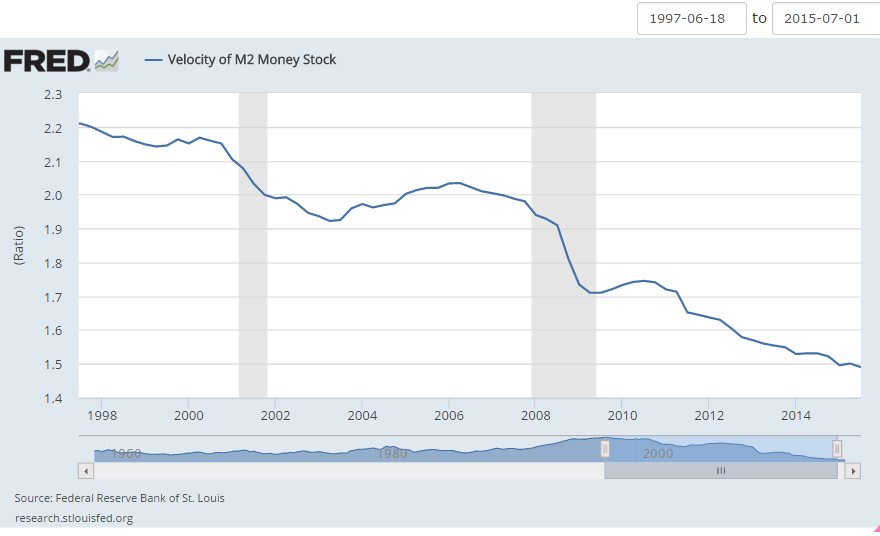
Money velocity (the turnover of money, GDP/money supply) continues its decline. Money supply is backward looking, a lagging indicator akin to driving while looking in the rear view mirror. Even so, it is not encouraging. Any pick up could be a significant indicator of inflation. For context the graph goes back to 1997. Somehow we can’t see the Great Recovery: can you?
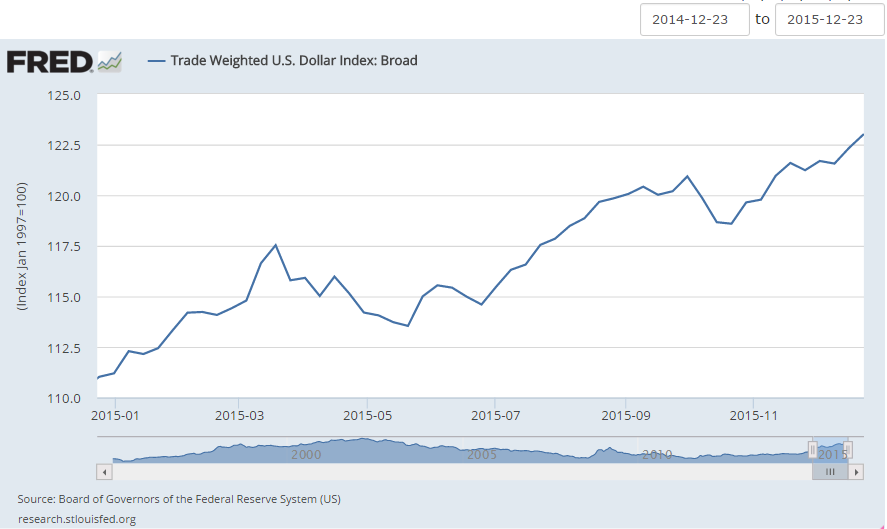
Currencies: the US$ continues its ascent. It may very well continue as more countries wrongly see devaluation rather than fundamental reform as a means to bolster their economies, akin to survivors on a raft drinking salt water. The US$ is seen as a safe haven and periodic flights of capital will continue. We are mostly agnostic on this as most multinational corporations have by virtue of their operations a diversified and managed portfolio of US / foreign / developed / emerging cash flows & liabilities. Entities that do not, including some central banks, will entertain non-trivial risk, and we’ve seen it already in the emerging markets.
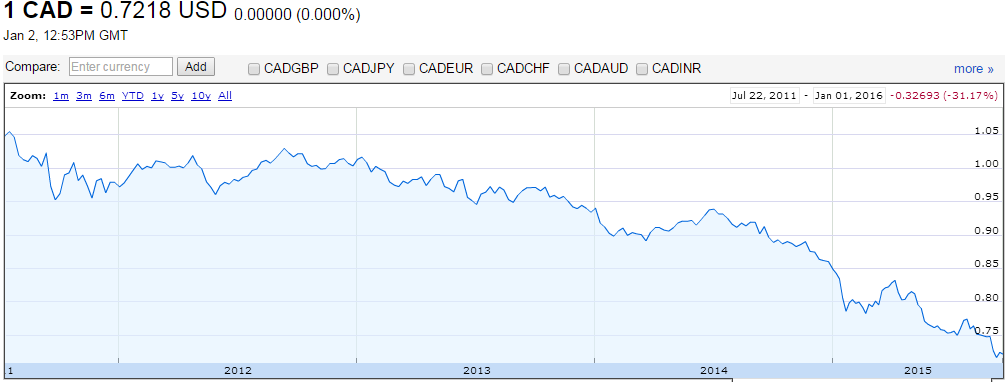
Our unhappy friends to the north had the concentration of their economy in the energy sector marked to market quite dramatically. Look at the magnitude of the fall of the C$, going from a peak of US$1.05 to US$.72 in ~4 years. Now think in terms of the Middle East and Russia... same thing.
So what does all this this mean for investors?
The effectiveness of ‘expert’ forecasting seems neither effective nor expert. US equity & fixed income markets seem to be fully valued. Europe and the emerging markets are cheaper, but they still remain... well, Europe and the emerging markets. Our view is that the biggest wild card is in fixed income: for all the Fed's jawboning about clarity and transparency, no one seems to have confidence in them. Perhaps a case of 'fool me once, shame on you...'
Investors should have realistic & modest expectations for returns, both equity and fixed income, over the intermediate term.
- “While reaching full employment does not necessarily suggest an imminent end to the current bull market, it does suggest investors should anticipate significantly smaller future returns.” - James W. Paulsen, Ph.D Chief Investment Strategist, Wells Capital Management, Inc. (Note: we’re not altogether sure we buy the reported employment numbers that suggest employment is close to full, but Paulsen's point is very well taken.)
- Vanguard’s Economic & Investment Outlook sees the medium term outlook for global equities in the 6-8% range with the a fair value 10 year Treasury ~ 2.5%.
- WWB doesn’t forecast but if asked we’d suggest Vanguard may be overly optimistic and would skew to the area of 3-7% for global equities with a boatload of volatility in between. Put plainly periodic returns between now and the end of the intermediate term could be negative.
- On the fixed income side WWB agrees with Vanguard's expection of intermediate trend 10 year Treasury rate of ~2.5% but we see a ~40% probability of the 10 year Treasury floating downwards and perhaps pushing below 2%.
- At the risk of sounding repetetive uncertainty mandates portfolio diversification.
The last quarterly review brought us the “We are at a monetary moment.” and it is true. What ails our economy and markets is structural and involves long term changes. Our problem is defective leadership and policy. The very good news is that these can be changed in the coming election... for better or worse.
We have frequently lauded the state of US based multinationals as a source of stability of our economy, and that remains true. They have also been a source of rent seeking behavior which needs to change. We have noted the erosion of the rule of law in the past decade. This also needs to change to restore our individual freedoms which will return integrity to the pricing mechanic which at base is nothing more than processed information as valued by customers and producers alike. That unleashes the wisdom of crowds, the aggregate and continuous judgement & productivity of our human capital, which remains our most underutilized asset.
We are also at a huge point of inflection in terms of most fields of technology: genomics, computational analytics (both quantum & DNA based computing), self learning artificial intelligence, salt bath nuclear generators, small particles and a bunch more we don’t even know about.
Anything north of ‘stop the bleeding’ in 2016 may very well have significant long term upside for equity markets. Our wounds are largely self inflicted. Every day millions of people get up and go to work trying to build & discover new things that go better, faster, cheaper. No country in the world has responded to change better than the US. We shouldn’t short ourselves just yet, but we would put our seatbelts on. It could be a wild year.
So, diversify and endeavor to persevere in 2016.
...
“It is very bad policy to ask one flying machine man about the experiments of another, because every flying machine man thinks that his method is the only correct one.” - Wilbur Wright, Experiments and Observations in Soaring Flight, 1903
...
“aiming for 2 percent inflation every year means that after a decade prices are more than 25 percent higher, and the price level doubles every generation. That is not price stability, yet they call it price stability. I just do not understand central banks wanting a little inflation.” - Paul Volcker, former Fed chairman
 hb
hb
US manufacturers see weakest demand in 6 years : "The Institute for Supply Management’s monthly manufacturing index slipped to 48.2 in December, marking the second month in a row that it had fallen below 50, the line between contraction and expansion. The reading was the weakest since June 2009 and marked the first time since the immediate aftermath of the global financial crisis that the US manufacturingsector has seen consecutive contractions."
hb
The fine print: The total return data we post uses broad based ETFs or other products that represent the particular sectors at hand and while we hold Vanguard product in high regard our use of them or others as an example does not constitute an investment recommendation.
- VGSH- Vanguard Short Term Government Bond
- VGIT- Vanguard Intermediate Government Bond
- VGLT- Vanguard Long Term Government Bond
- VGSH- Vanguard Short Term Investment Grade Bond
- VTI- Vanguard Total US Stock Market
- VEU- Vanguard FTSE All World Ex US
- VWO- Vanguard FTSE Emerging Markets
- GSG- iShares S&P Commodity-Indexed Trust
- GLD- SPDR Gold Shares
- OIL- iPath S&P GSCI Crude Oil
hb
The Global Slowdown Hits the US in the WSJ.
hb
"the FED released its latest quarterly senior loan officers survey [which] showed... that in Q4, lending standards tightened for the second consecutive quarter. This is problematic because ... two consecutive quarters of tightening standards "has never happened before without it signalling an eventual move into recession and a notable default cycle. Once we have 2 such quarters lending standards don't net loosen again until the start of the next cycle."
How The Fed Unwittingly Confirmed A Recession And A Default Cycle Are Now Inevitable
Reader Comments