On mythology: Q1 2015 review & outlook
Our fundamental outlook has not changed from last quarter’s review, and we think we got the broader mechanics right. We actually suggest readers go back and read the first five paragraphs. These are long lived themes, and we’re going to be multiplying and extending some of them.
What is new, or slightly different, is that the pressures are building, some accelerating, and there seems to be increasing recognition by the markets and electorate that something is amiss. The edges are fraying. This begs the question of tipping points, of the fragility of markets, belief systems, if not social stability. The themes that dominate our thoughts are not strictly related to investment theory, but to the disintegration of large mythologies embedded in much of our social, monetary & fiscal policies. In statistical analysis there are two forms of errors. A Type I error rejects a correct hypothesis, and a Type II error fails to reject a false hypothesis. We likely have a smattering of both in major policy areas, and there seems to be an increasing openness to that consideration. There is also the base issue of fair disclosure in that regard. Our own observation is that people really don’t like it when they are lied to or, in the words of our President, “messed with.” Indeed.
It seems some of the underlying tenets of policy are being more broadly questioned in public.
-
“the unemployment rate is low, hence labor markets are strong”
-
“the economic recovery is solid”
-
“current monetary policy preserves our wealth & stability”
-
“reforms to financial regulation are effective”
-
“federal debt is not problematic”
So what happens if some of the veneer of credibility erodes a bit more?
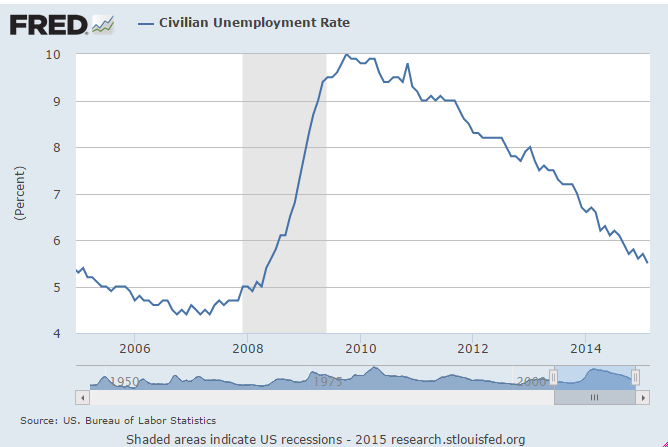
The unemployment myth: What would the unemployment rate look like if the economy had the same labor force participation rate — 65.7 percent — as it did when the recession ended in June of 2009? It would be more than 10%:
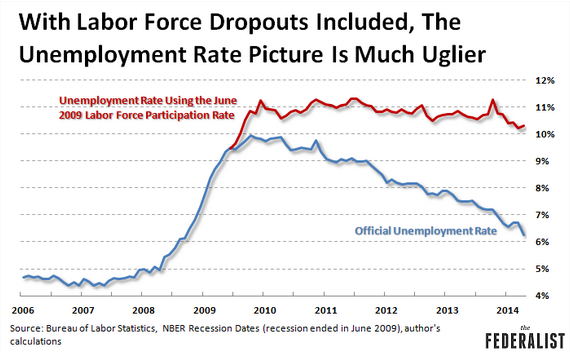
Well, what has happened to the labor force participation rate? It has dramatically declined. Look at the red line below: it goes down. Look at the blue line go up. What happens when you don’t “participate”? Well, you don’t get counted as being in the “labor force” and hence, you no longer count as “unemployed” which drives the official “unemployment rate” down.
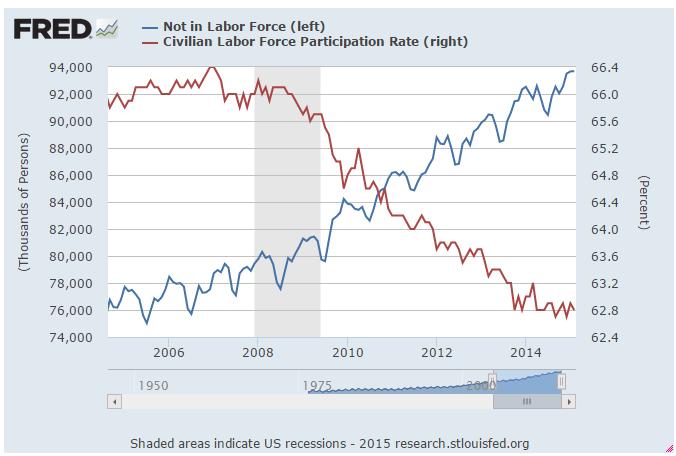
So the “narrative” of a low unemployment rate is constructive fraud to mask the emergence of a permanent welfare state? Nevertheless, we see the Unemployment Rate cited by the Fed as a primary concern of labor capacity utilization.
The Quantitative Easing & Great Recovery myth: fiscal policy and governance has been delegated, or rather abdicated, to central banks. Yet now some louder voices openly question whether QE actually makes us poorer and increases our risk. Yet we, meaning US, Europe and Asia, are globally in synchronized, although not perfectly so, and ‘all in’ for QE. We leave to our readers to assess whether the Fed’s credibility has risen or is more open to question lately.
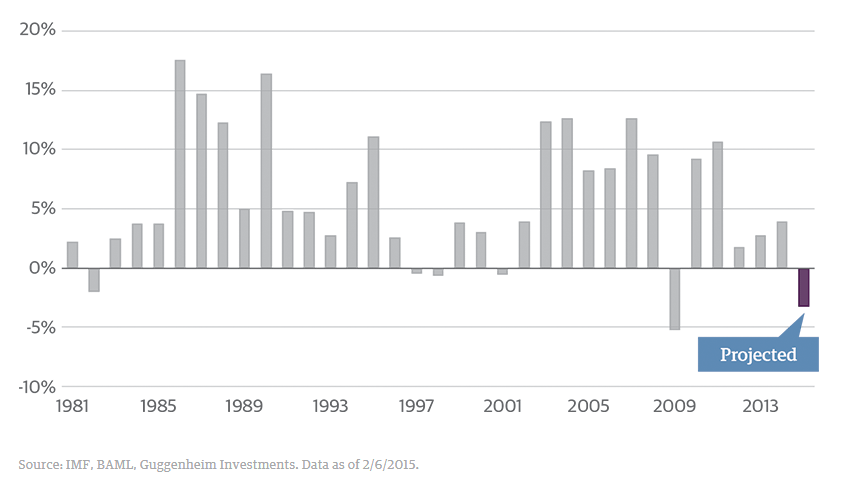
“With a surging U.S. dollar and growth remaining sluggish in much of the world, Bank of America Merrill Lynch forecasts that world output measured in dollars could fall in 2015 for the first time since the financial crisis. Over the past 34 years, this has happened just five times.”
http://guggenheimpartners.com/perspectives/media/the-monetary-illusion
Global nominal GDP growth, as measured in dollars, is projected to decline:
http://guggenheimpartners.com/perspectives/media/the-monetary-illusion
Real median income of the US family has declined dramatically since late 2008
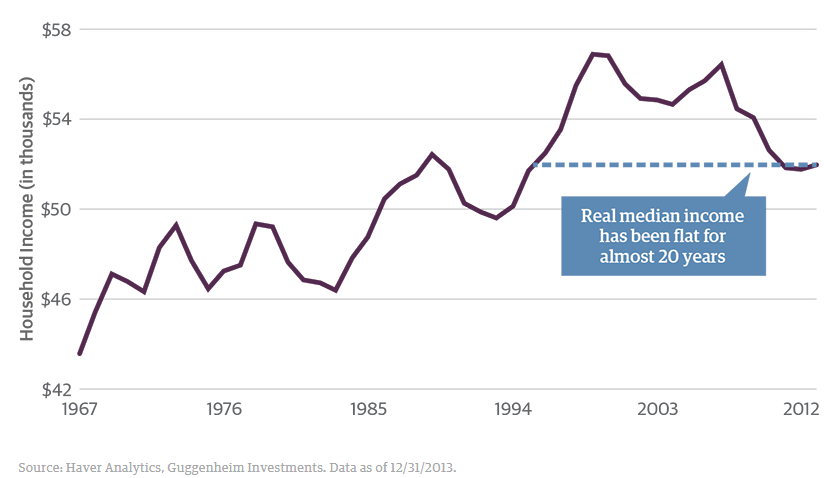
“In the long run, however, classical economics would tell us that the pricing distortions created by the current global regimes of QE will lead to a suboptimal allocation of capital and investment, which will result in lower output and lower standards of living over time. In fact, although U.S. equity prices are setting record highs, real median household incomes are 9 percent lower than 1999 highs. The report from Bank of America Merrill Lynch plainly supports the conclusion that QE and the associated currency depreciation is not leading to higher global output.
The cost of QE is greater than the income lost to savers and investors. The long-term consequence of the new monetary orthodoxy is likely to permanently impair living standards for generations to come while creating a false illusion of reviving prosperity.”
http://guggenheimpartners.com/perspectives/media/the-monetary-illusion
Well, let’s particularize that a bit. Say that you’re retired with $5mm in savings from a life of hard work. Further, let’s assume you have a 50/50 fixed income allocation, so you have $2.5mm in fixed income. From 2008 to today your fixed income portfolio has sacrificed greatly to the cause of QE. The yield on 10 year Treasury dropped from ~5% to 2.5%. That’s a 50% decrease in income on $2.5mm which comes to about $62,500/year for 7 years... so by this rough illustration, by fiat of Fed policy you lost $437,500.
Now extend that ‘taking’ if you will, across the entire universe of investors - individuals and institutions - and you have a considerable dead weight levied to the economy. It has been the largest wealth transfer in global history and it continues...
We also note that the QE debt has to be repaid, and this is where the long term impairment of our standard of living comes into play.
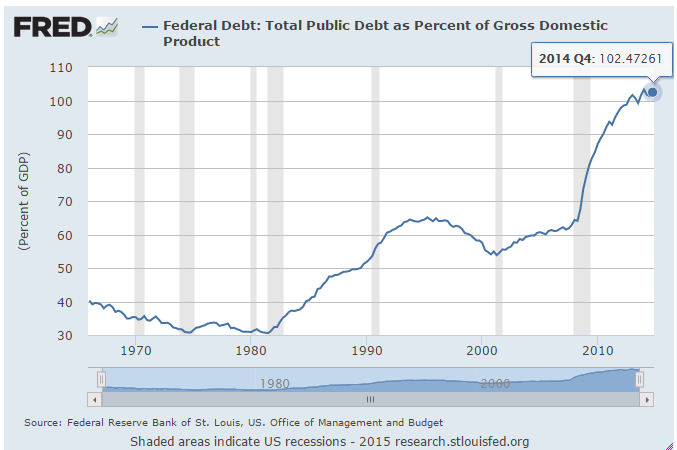
The funded debt of our government as considered above does not include off balance sheet pension, social and other liabilities which are of far greater magnitude. QE and the massive stimulus of government spending were supposed to provide a roaring recovery. Instead we have record and unsustainable levels of debt.
If you’re paying back a lot of debt you’re not making new productive investments. Ask any recent graduate with a student loan or young families or a highly levered company.
As to the economic outlook we present the Conference Board’s forecast below, but preface it with an anecdotal comment made to us over lunch the other day from a different source:
“Everyone I know is cutting their capital expenditures by 30-40%. The only real hiring is for compliance or audit...” - founder and manager of a $1.5 bn hedge fund
.
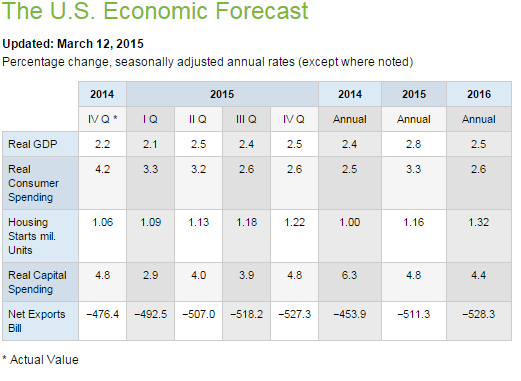
https://www.conference-board.org/data/usforecast.cfm
We think the real GDP forecast is a bit high, but we’ll get to that later. We don’t think 2.8% in 2015 is going to happen. Look at the change in growth rates of capital spending on the margin. That is signal. You will see a 30% decline in the anticipated growth rates (from 6.3% to 4.4%) from 2014 to 2016. Business is trimming the growth rate capital expenditures by huge magnitudes. Bear in mind these are long lived assets that impact future efficiency & earnings potential. Or rather, they’re not going to be which is lost opportunity for wealth creation.
Jim Paulson of Wells Fargo puts forth this chart of investment and productivity. Eyeball the chart and note we are back to levels of the 1950’s. One can't help but recall when Obama was elected.
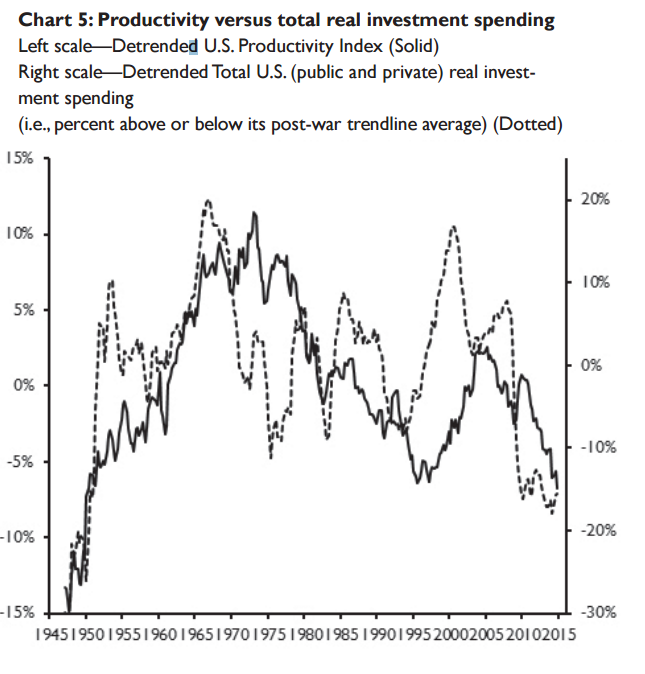
http://www.wellscap.com/docs/emp/20150320.pdf
The future taxes related to ObamaCare alone represent about a 350% increase from 2014 to 2022. We don’t see how the consumer is going to have a nice day, and the middle class will be crushed. Another wealth transfer.
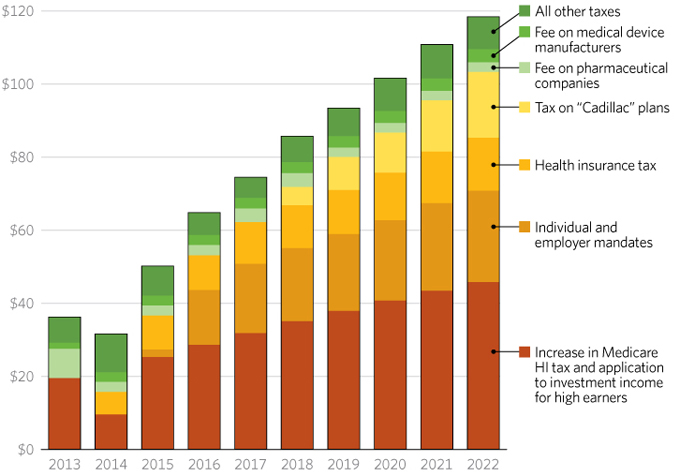
http://www.heritage.org/federalbudget/charts/2015/obamacare-tax-hikes-680.jpg
Of course, QE is printing money by debt creation, and money is currency.
If one admits the possibility of the premise that QE is ineffective and possibly corrosive to the real economy, then consider the recent alleged statements of a man who knows a bunch about financial failure and is desperate for a fix, Yanis Varoufakis, Finance Minister of Greece:
“We'll go to Bitcoin, we will be ahead of all the world economies and although it may be painful in the beginning, Greece’s economy will thrive in the long term...The future starts in Greece and we will be the first country to use the currency of the future, a currency that doesn’t allow third parties to tell us what to do or how to live, this is the Greek thing to do”
A little melodramatic considering that Greece has a GDP of about the size of Connecticut although we do note the similarity of their fiscal policies. We think, however, our ‘homie’ Yanis may have hit upon a coming, major theme of domestic US governance. Audit the Fed, anyone? As to Bitcoin, who knows? But it is non-trivial when a country threatens to dump its beloved, though busted Drachmas and walk away from the Euro... for Bitcoin. Not a good sign of monetary success anywhere.
So what does the new monetary orthodoxy then deliver? From Reuter’s recent article U.S. private payrolls, factory data point to weak economic growth:
"The U.S. economic recovery is continuing to leak momentum. Growth is expected to slow to a crawl in the first quarter," said Millan Mulraine, deputy chief economist at TD Securities in New York.
The ADP National Employment Report on Wednesday showed that private payrolls increased by 189,000 jobs last month, the smallest gain since January 2014. That was well below economists' expectations for an increase of 225,000. Manufacturing payrolls declined for the first time since January of last year...
"There are some good reasons to think that the job growth has slowed, that we're not going to see monthly job gains of 300,000 for a while," said Mark Zandi, chief economist of Moody's Analytics.
... In a separate report, the Institute for Supply Management (ISM) said its national factory activity index fell to 51.5 last month, the lowest reading since May 2013, from 52.9 in February.”
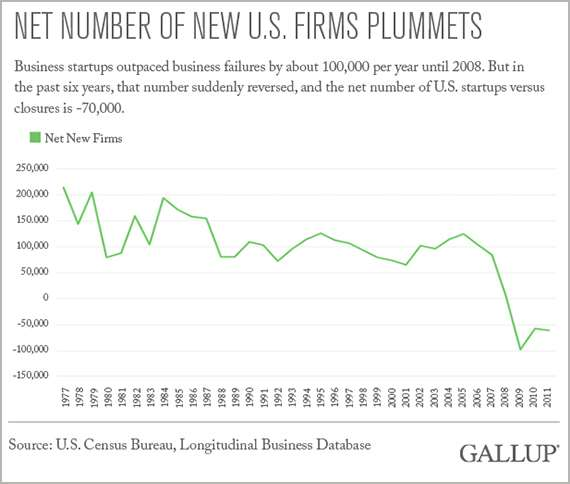
Net new business formation
We also see a bad scenario of net new business formation. The problem, of course, is that declining net new firms means fewer Microsoft's, Amazons, Google's etc. in the future. We may very well see more Solyndra’s or GreenTech Automotive’s . Anyone in commerce will tell you that the small business complex is suffering greatly, and it is a huge engine for the middle class.
Well, how are the fixed income markets looking at things? We note how today’s (4/7) auction of 3 year treasuries went:
“Anyone wondering what the bond market thinks about the prospects of an imminent rate hike need but look at the high yield of the just concluded 3 Year auction, which saw a yield of only 0.865%, pricing through the 0.87% when issued, and the lowest since March of 2014.”
http://www.zerohedge.com/news/2015-04-07/solid-3-year-auction-prices-lowest-yield-march-2014
Why would you buy at record low yields if you were anticipating a rate hike by the Fed? You wouldn’t.
Liquidity and the repo markets
More importantly we look to another dimension: the repo markets which are the foundational source of liquidity in the market we used to know. Something big is stressed, or changing, and we can see it in the repo markets. First look at the 10 yr Treasury repo rates on an absolute basis. The picture below reflects a shortage of 10 year Treasury bonds, high quality collateral.
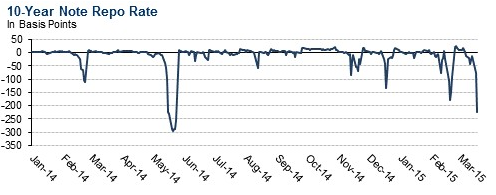
http://www.zerohedge.com/news/2015-04-07/solid-3-year-auction-prices-lowest-yield-march-2014
We excerpt below from Alhambra Investment Partners Jeffery P Snider’s Twelve Years Unheeded and highly recommend it. They get it and bring a high level of expertise to this obscure but hugely important market. While the 10 yr Treasury goes on ‘special’, they see another phenomena in the MBS sector (mortgage backed security):
“In this specific case, I am talking about repo capacity and the systemic ability to absorb large changes – which is all that liquidity is really about to begin with. Since October 15, that major domestic side of a liquidity event, repo volume in MBS has nearly doubled. That sounds like a positive outcome but since we are talking about what amounts to bedrock liquidity it isn’t at all clear if that is the correct categorization. It may very well be that such a rise in MBS, especially, marks not an increase in capacity but an almost last resort before detaching into a full-blown break.”
http://www.alhambrapartners.com/2015/04/06/twelve-years-unheeded/
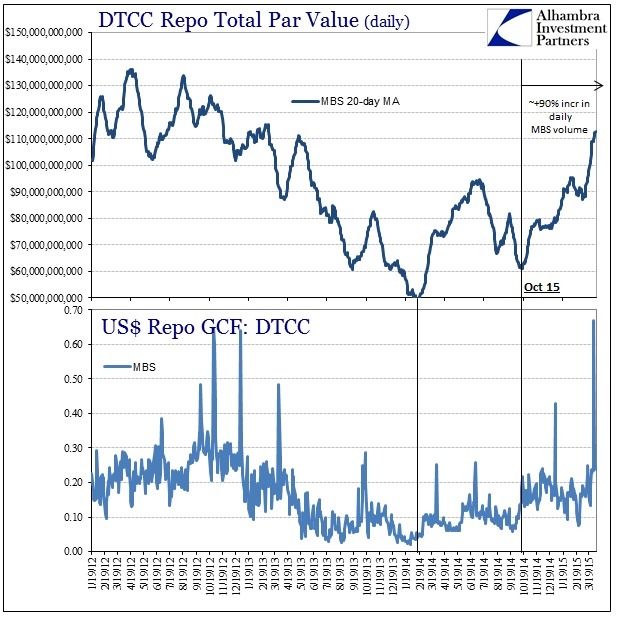
http://www.alhambrapartners.com/wp-content/uploads/2015/04/ABOOK-April-2015-Repo-MBS.jpg
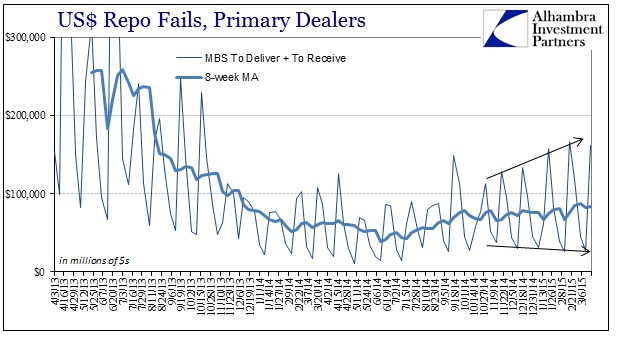
Lastly, they look at repo fails, that is failures to deliver collateral, in the MBS sector (below):
“Ever since October, MBS fails have increased in deviation if not in average. That would suggest greater uncertainty, relative to the post-2013 crash existence, more recently about collateral regimes as volumes rise. In other words, it seems another element of strain if only by relative comparison.” ibid
We note the dispersion although it is not clear that the timeframe is sufficiently long to be dispositive. Still... it is non-trivial.
Liquidity and capital: the plumbing
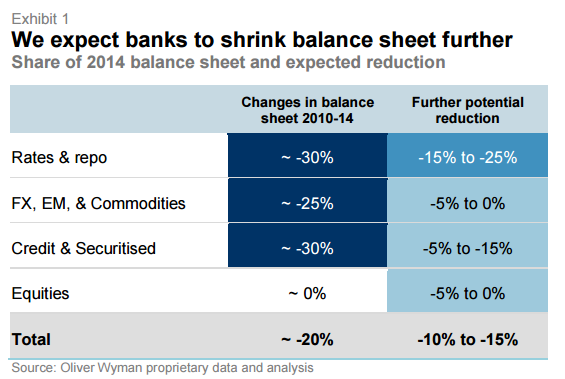
Now we turn to the study by Morgan Stanley and Oliver Wyman of March 19, 2015, Wholesale & Investment Banking Outlook Liquidity Conundrum: Shifting risks, what it means from which we excerpt below. The thesis is that wholesale banks have, as motivated or required by regulation, shrunk balance sheets to meet regulatory capital requirements. Readers will recall the shell game of “stress tests” old and new, etc. Anyone who has ever sat on a trading or loan desk knows the quickest way to reduce capital usage is to shrink inventory and sell assets. No problem:
“Wholesale banking balance sheets supporting traded markets have decreased by 40% in risk weighted assets terms and 20% in total balance sheet since 2010. At the same time, credit markets have boomed as companies turn more to bond finance and investors are hungry for income. Credit market issuance is 2.4 times larger today than 2005. Within this, AuM in daily redeemable funds have grown 10% per annum and are now 76% above 2008 levels. “
And diminishing returns on capital from market making drive more and faster structural change, less capital, less inventory & balance sheet risk, and less liquidity for the market.
The law of unintended consequences
So we see that regulation, the intent of implementing higher capital standards for the banks and broker dealer complex, has had the consequence, unforeseen or not, of reducing liquidity in the markets. As the banks and brokers trim capital, trading inventories get reduced. Simultaneously, the absolute level of rates has impaired the profitability of the short end fixed income business, so staffing gets reduced. Now that resources & infrastructure dedicated to liquidity have been dramatically reduced, what happened to liquidity risk? Squeeze one end of the balloon and see what happens. Assuming the prior capital, both financial & human, had utility in liquidity/risk space, one might ask where did it go? Where is the risk? Well, we don’t know for sure, but something tells me it didn’t go away. There are several places where it can temporarily hide, and perhaps we’ve just seen a few, but as currently configured there are a limited number of final destinations: the Fed or investors.
Reality, not mythology, is good for markets. Fixing flawed policy is good for the economy, though not for all segments and not without the risk of volatility in the adjustment.
...
Lastly, we close with a once dominant & euphoric myth:
“Europe has never been so prosperous, so secure nor so free. The violence of the first half of the 20th century has given way to a period of peace and stability unprecedented in European history. The creation of the European Union has been central to this development . . . Large-scale aggression against any member-state is now improbable.” - introduction to EU Security Strategy adopted in 2003
 hb
hb
Two articles came to our attention after we posted: big voices also speaking out.
First, we have Swiss Re's commentary Turn off the money tap - our economy is drowning:
"US savers alone have lost a whopping USD 470 billion in interest rate income, net of lower debt costs. This is just one upshot of central banks' unconventional monetary policies initially enacted to manage the crisis....
Capital markets' ability to function well also comes under threat. Artificially low yields crowd long-term investors out of the market, preventing them from pumping savings into the real economy to stimulate growth. This reduces the diversification of funding sources to the economy, representing a risk for financial stability at large."
They put the big bullets in this 36 page report, however: FINANCIAL REPRESSION: THE UNINTENDED CONSEQUENCES
...
And JP Morgan weighed in somewhat indelicately in 'Once-in-3-Billion-Year' Jump in Bonds Was a Warning Shot, Dimon Says:
Reader Comments